Running LCZ4r in Posit Cloud
Max Anjos
April 24, 2026
Source:vignettes/posit_cloud.Rmd
posit_cloud.RmdIntroduction
Welcome to the LCZ4r package demonstration on Posit Cloud! This guide will walk you through the steps to run LCZ4r and explore its powerful tools for Local Climate Zone (LCZ) analysis in a cloud-based environment.
Why Posit Cloud?
Posit Cloud (formerly RStudio Cloud) offers several advantages for LCZ4r users: - No installation required: Run R and LCZ4r directly in your browser - Pre-configured environment: All dependencies are already installed - Access anywhere: Work from any computer with internet access - Collaboration ready: Share projects with colleagues easily - Free tier available: Get started without any cost
Getting Started
Follow these step-by-step instructions to access and run LCZ4r in Posit Cloud:
1 Access the Posit Workspace
Click on the following link to access the LCZ4r workspace:
🔗 LCZ4r Demo Workspace: https://posit.cloud/content/9921467
2 Log in or Create an Account
- If you don’t already have a Posit Cloud account, click “Sign Up” to create one (free tier available)
- Log in to your account to access the workspace
- You can use your Google or GitHub account for quick registration
3 Save a Permanent Copy
Important: Make sure to Save a Permanent Copy of the project:
- Click on the project name in the top-left corner
- Select “Save a Permanent Copy” from the dropdown menu
- Choose a name for your copy (e.g., “My LCZ4r Analysis”)
- This ensures you have your own version that won’t be affected by changes to the original
4 Explore the R Scripts
The project contains three main R scripts organized by functionality:
Demonstrates general functions for LCZ analysis, including:
- Downloading and visualizing LCZ maps from global datasets
- Calculating LCZ areas and urban canopy parameters
- Plotting basic LCZ maps and statistics
Focuses on localized LCZ analysis with advanced capabilities:
- Time series analysis of air temperature
- Thermal anomaly calculations
- Spatial interpolation with kriging
- Urban Heat Island intensity assessment
Specialized temperature modeling and UHI analysis:
- Temperature interpolation and mapping
- Thermal anomaly mapping
- UHI intensity calculation by LCZ class
- Model evaluation and validation
5 Run the Scripts
Good news: The LCZ4r package and all dependencies are already installed in the Posit Cloud environment, so you’re ready to go!
To run the scripts: 1. Open each script by clicking on its name in
the Files pane 2. Run code line-by-line with Ctrl + Enter
(or Cmd + Enter on Mac) 3. Or run entire sections by
selecting code and clicking “Run” 4. Explore the results in the Console
and Plots panes
Visualizing the Workspace
Below is a screenshot of the Posit Cloud workspace to help you get oriented:
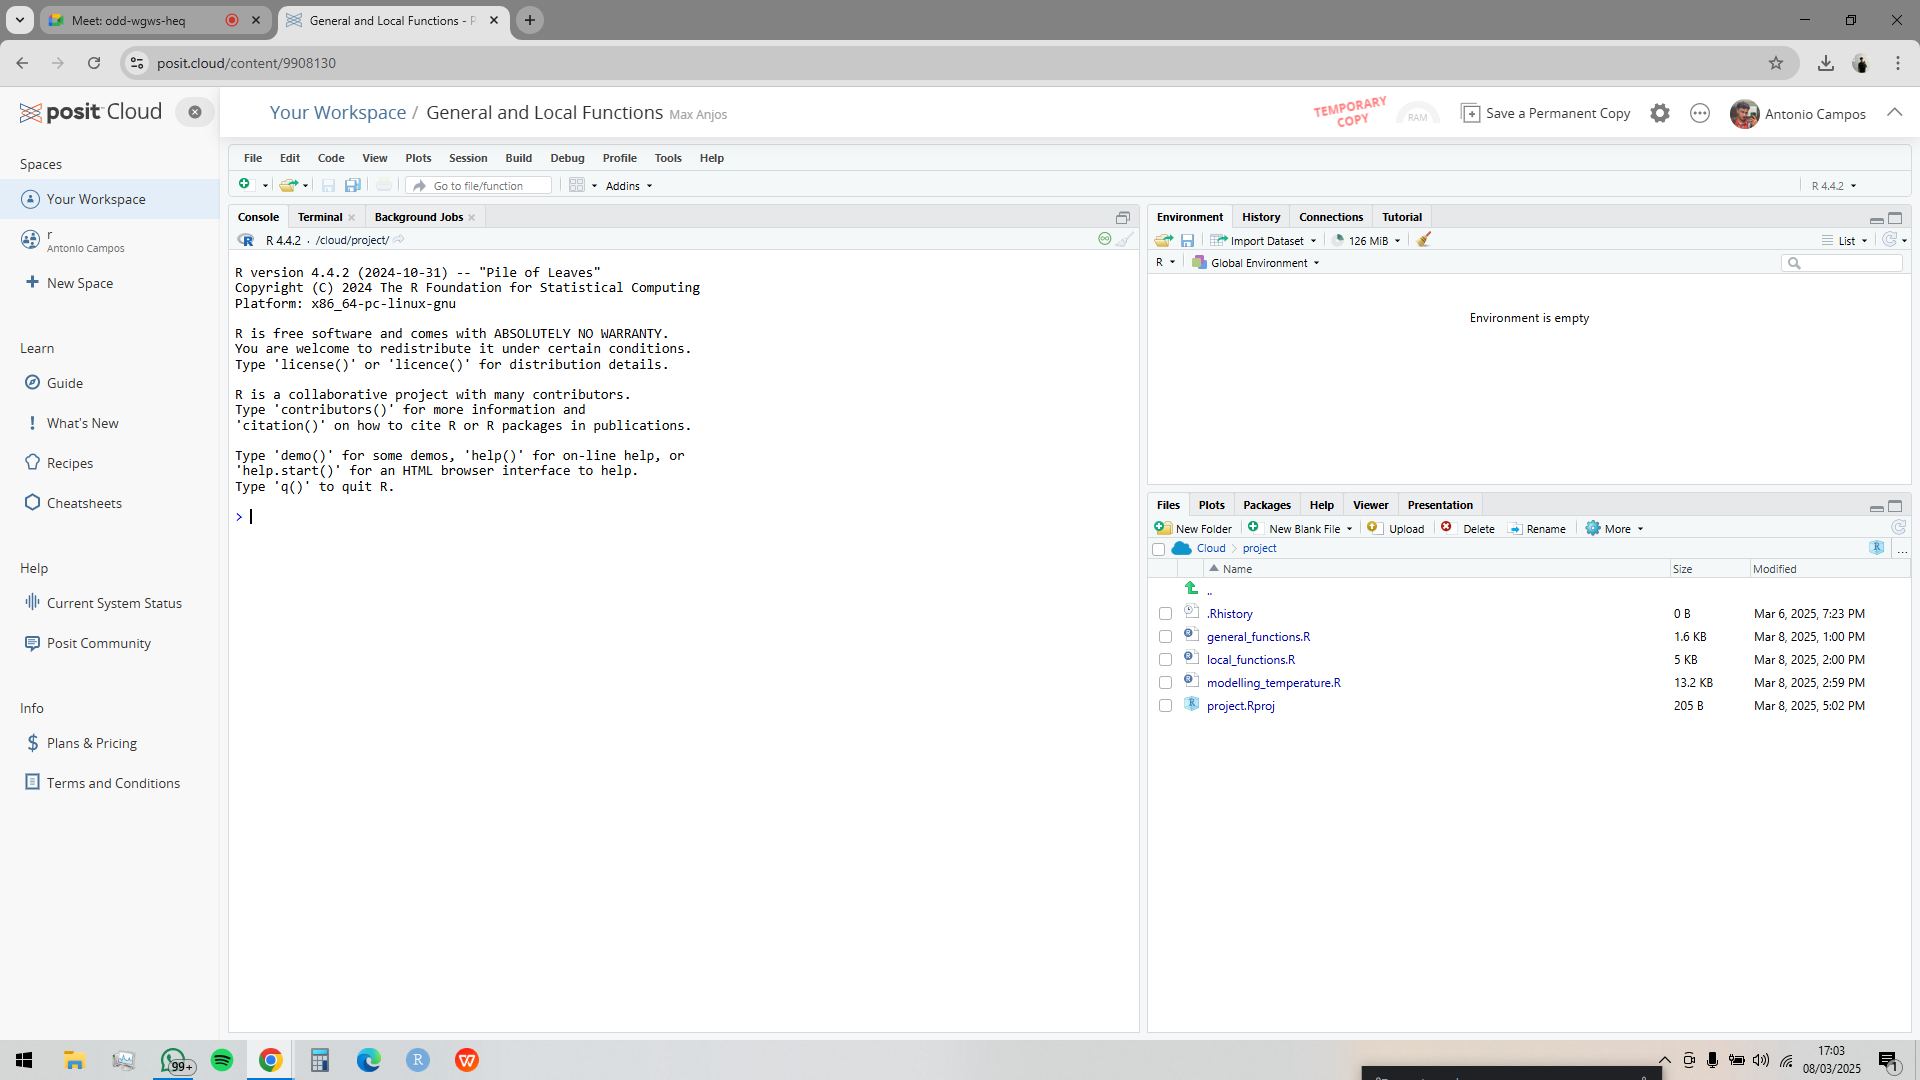
Posit Cloud workspace interface showing the LCZ4r demo project with the file explorer, code editor, and console panes.
Workspace Overview
Running Your First Analysis
Let’s test that everything is working correctly:
# Load the LCZ4r package
library(LCZ4r)

# Test with a simple LCZ map download
lcz_map <- lcz_get_map(city = "Berlin")

# Visualize the map
lcz_plot_map(lcz_map)
If you see an LCZ map appear in the Plots panel, everything is working correctly!
Troubleshooting Common Issues
Connection Timeouts
If you experience connection timeouts when downloading LCZ maps: -
Check your internet connection - Try again during off-peak hours - Use
the lcz_get_map_generator() function with a known ID for
faster access
Memory Limitations
The free tier of Posit Cloud has limited memory (1 GB): - Start with
smaller spatial resolutions (e.g., sp.res = 500 instead of
100) - Process data for shorter time periods first - Use
gc() to clear memory when needed - Consider upgrading to a
paid plan for larger analyses
Saving Your Work
- Your project is automatically saved in Posit Cloud
- Export plots using the “Export” button in the Plots panel
- Download results using
write.csv()for data frames - Save maps with
writeRaster()for raster outputs
Customizing Your Workspace
Adding Additional Packages
If you need additional packages beyond those pre-installed:
# Install packages as needed
install.packages("package_name")

# For GitHub packages
if (!require("remotes")) install.packages("remotes")
remotes::install_github("username/repository")
Creating New Scripts
- Click “New File” → “R Script” in the Files pane
- Write your analysis code
- Save with an appropriate name (e.g., “my_analysis.R”)
Organizing Outputs
Create folders to keep your work organized:
# Create output directories
dir.create("figures", showWarnings = FALSE)
dir.create("data", showWarnings = FALSE)
dir.create("results", showWarnings = FALSE)

# Save plots to the figures folder
ggsave("figures/my_plot.png", width = 8, height = 6)

# Save data to the data folder
write.csv(my_data, "data/my_results.csv", row.names = FALSE)
Collaboration Features
Posit Cloud makes collaboration easy:
- Share your project: Click “Share” button to invite collaborators
- Set permissions: Choose “View” or “Edit” access levels
- Real-time collaboration: Work simultaneously with team members
- Version history: Access previous versions of your work
Learning Resources
To get the most out of LCZ4r on Posit Cloud:
| Resource | Description |
|---|---|
| LCZ4r Documentation | Complete package documentation and examples |
| R for Data Science | Learn R programming fundamentals |
| Spatial Data Science | Advanced spatial analysis in R |
| LCZ Generator | Access LCZ maps for your study areas |
Quick Reference
Essential Keyboard Shortcuts
| Action | Windows/Linux | Mac |
|---|---|---|
| Run current line/selection | Ctrl + Enter |
Cmd + Enter |
| Run entire script | Ctrl + Shift + Enter |
Cmd + Shift + Enter |
| Clear console | Ctrl + L |
Cmd + L |
| Comment/uncomment lines | Ctrl + Shift + C |
Cmd + Shift + C |
Useful Functions to Get Started
# Check package version
packageVersion("LCZ4r")

# Get help for any function
?lcz_get_map

# List all LCZ4r functions
ls("package:LCZ4r")

# View available datasets
data(package = "LCZ4r")
Frequently Asked Questions
Q: Can I use my own data in Posit Cloud?
A: Yes! Upload your data files through the Files pane (Upload button)
or use read.csv() with a URL to your data.
Q: How long will my Posit Cloud project be available?
A: Free accounts have up to 25 project hours per month. Paid accounts have unlimited hours. Your projects remain indefinitely as long as you maintain your account.
Q: Can I install additional packages?
A: Yes, you can install any CRAN or GitHub package using
install.packages() or
remotes::install_github().
Q: How do I export my results?
A: Use write.csv() for data frames,
writeRaster() for spatial rasters, and the “Export” button
in the Plots panel for graphics.
Q: What if the demo workspace is unavailable?
A: You can create a new Posit Cloud project and manually install
LCZ4r using
remotes::install_github("ByMaxAnjos/LCZ4r").
Have feedback or suggestions?
Do you have an idea for improvement or did you spot a mistake? We’d love to hear from you! Click the button below to create a new issue (GitHub) and share your feedback or suggestions directly with us.
Open GitHub issue