Mastering LCZ4r General Functions in QGIS
Max Anjos
April 24, 2026
Source:vignettes/Introd_QGIS_LCZ4r_general.Rmd
Introd_QGIS_LCZ4r_general.RmdIntroduction
The LCZ4r General Functions are designed to facilitate the retrieval, analysis, and visualization of Local Climate Zones (LCZ) when LCZ-related data is not readily available. These functions enable users to:
- Download LCZ maps from global datasets
- Compute LCZ classes and areas
-
Extract urban canopy parameters (UCPs) such as:
- Sky View Factor (SVF)
- Impervious Surface Fraction (ISF)
- Roughness Element Height (HRE)
- And many more!
![]()
What are General Functions?
The General Functions serve as the foundation of LCZ4r, providing essential tools for: - Data acquisition: Download LCZ maps for any city worldwide - Data processing: Calculate areas, extract parameters - Data visualization: Create publication-ready LCZ maps
📋 Overview of General Functions
The following functions are available in the LCZ4r General Functions section of your QGIS Processing Toolbox:
📥 Download LCZ Map
Download LCZ maps from global datasets (World, Europe, USA) or the LCZ Generator Platform
✂️ Clip LCZ Map
Clip LCZ maps to your city or custom Region of Interest (ROI)
🗺️ Plot LCZ Map
Visualize LCZ maps with customizable colors and labels
📐 Calculate LCZ Area
Compute area statistics for each LCZ class in your study area
📊 Get LCZ Parameters
Extract urban canopy parameters (SVF, ISF, HRE, etc.) for each LCZ
🎨 Plot LCZ Parameters
Visualize parameter maps (e.g., Sky View Factor, Roughness Length)
🚀 Getting Started
Prerequisites
Before using the General Functions, ensure you have:
- LCZ4r installed in QGIS (see installation guide)
- Processing R Provider plugin installed and configured
- Internet connection for downloading LCZ maps (first-time use)
Available Data Sources
| Source | Coverage | Function |
|---|---|---|
| Global LCZ Map | Worldwide | lcz_get_map() |
| European LCZ Map | Europe | lcz_get_map_euro() |
| USA LCZ Map | Continental US | lcz_get_map_usa() |
| LCZ Generator | Custom cities | lcz_get_map_generator() |
🗺️ Step-by-Step Tutorial
Step 1: Download an LCZ Map
1 Download LCZ Map for Your City
- In the Processing Toolbox, navigate to R → LCZ4r General Functions
- Double-click Download LCZ map
- Enter your city name (e.g., “São Paulo”, “Paris”, “Tokyo”)
- Choose the dataset (Global, Europe, or USA)
- Click Run
Output: A raster layer with LCZ classification for your city will be added to your QGIS canvas.
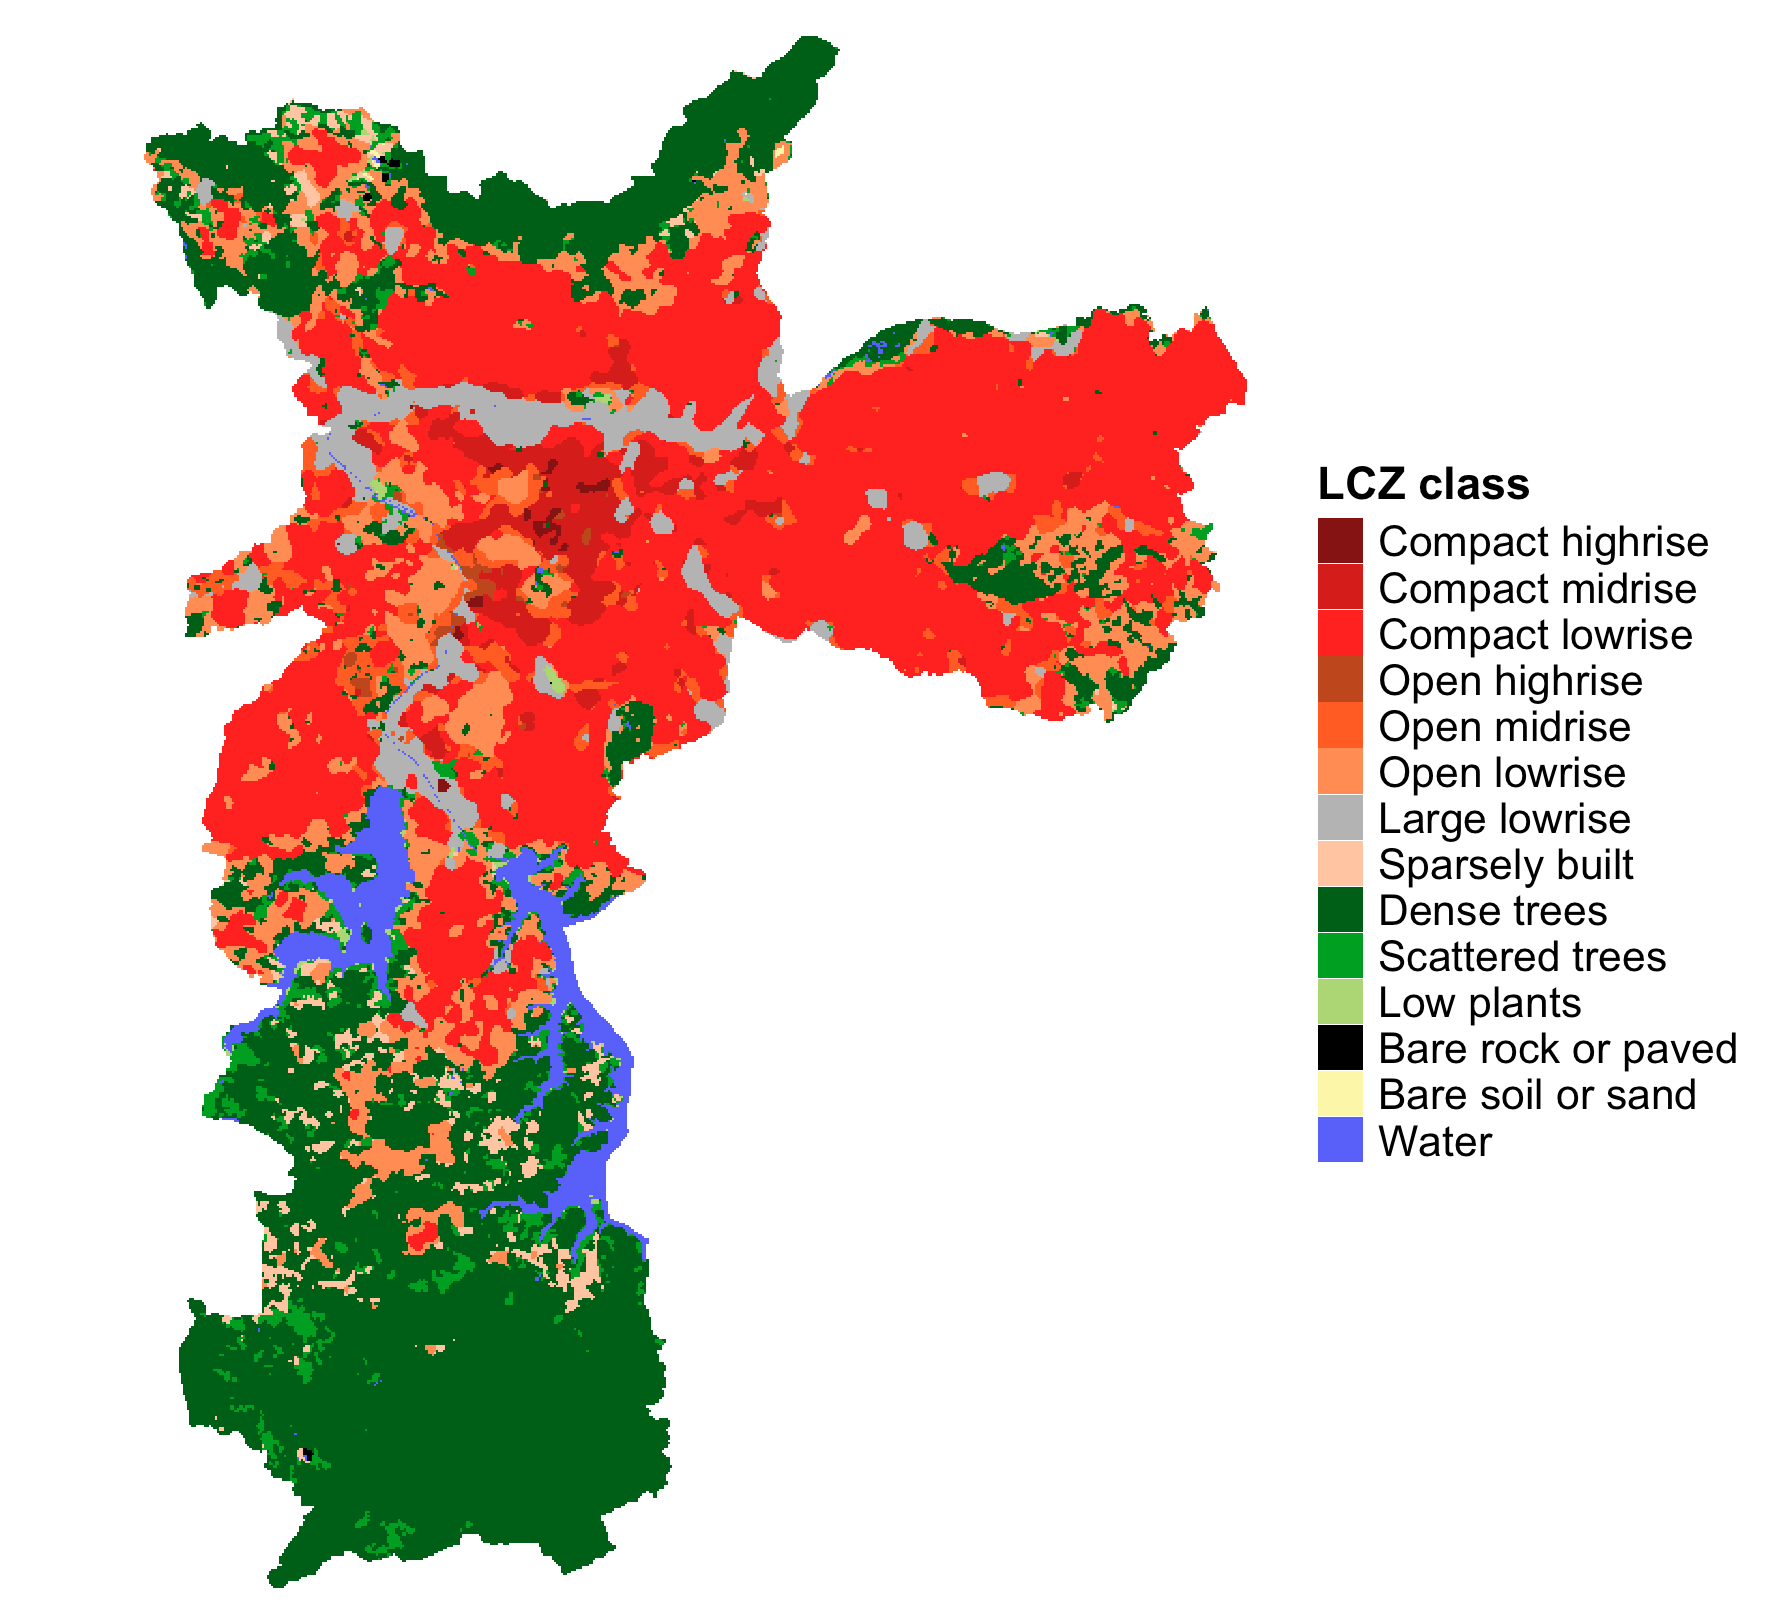
Example: LCZ map of São Paulo, Brazil
Step 2: Visualize Your LCZ Map
2 Customize and Visualize
- Double-click Plot LCZ map
- Select your downloaded LCZ map layer
- Customize colors and labels (optional)
- Click Run
Output: A publication-ready LCZ map with proper legend and color scheme.
Step 3: Calculate LCZ Areas
3 Compute Area Statistics
- Double-click Calculate LCZ area
- Select your LCZ map layer
- Click Run
Output: A table showing area (km²) and percentage for each LCZ class:
| LCZ Class | Area (km²) | Percentage |
|---|---|---|
| Compact mid-rise | 45.2 | 12.3% |
| Open low-rise | 78.5 | 21.4% |
| Dense trees | 32.1 | 8.7% |
| … | … | … |
Step 4: Extract Urban Canopy Parameters
4 Retrieve LCZ Parameters
- Double-click Get LCZ parameters
- Select your LCZ map layer
- Choose parameters of interest (e.g., SVFmean, BSFmax, HREmean)
- Click Run
Output: A raster stack containing selected parameters for each grid cell.
Available Parameters:
| Code | Parameter | Unit |
|---|---|---|
| SVFmean | Sky View Factor | [0-1] |
| BSFmean | Building Surface Fraction | [%] |
| ISFmean | Impervious Surface Fraction | [%] |
| HREmean | Height Roughness Elements | [m] |
| z0 | Roughness Length | [m] |
💡 Advanced Tips
Working with LCZ Generator Maps
For cities not covered in global datasets:
- Visit the LCZ Generator Platform
- Search for your city or upload your own training area
- Copy the submission ID
- Use Download LCZ map from Generator with the ID
📊 Example Workflow
Here’s a complete example workflow for a typical urban climate study:
# 1. Download LCZ map for Berlin
lcz_map <- lcz_get_map(city = "Berlin")
# 2. Calculate area distribution
lcz_areas <- lcz_cal_area(lcz_map)
# 3. Extract parameters
lcz_params <- lcz_get_parameters(lcz_map)
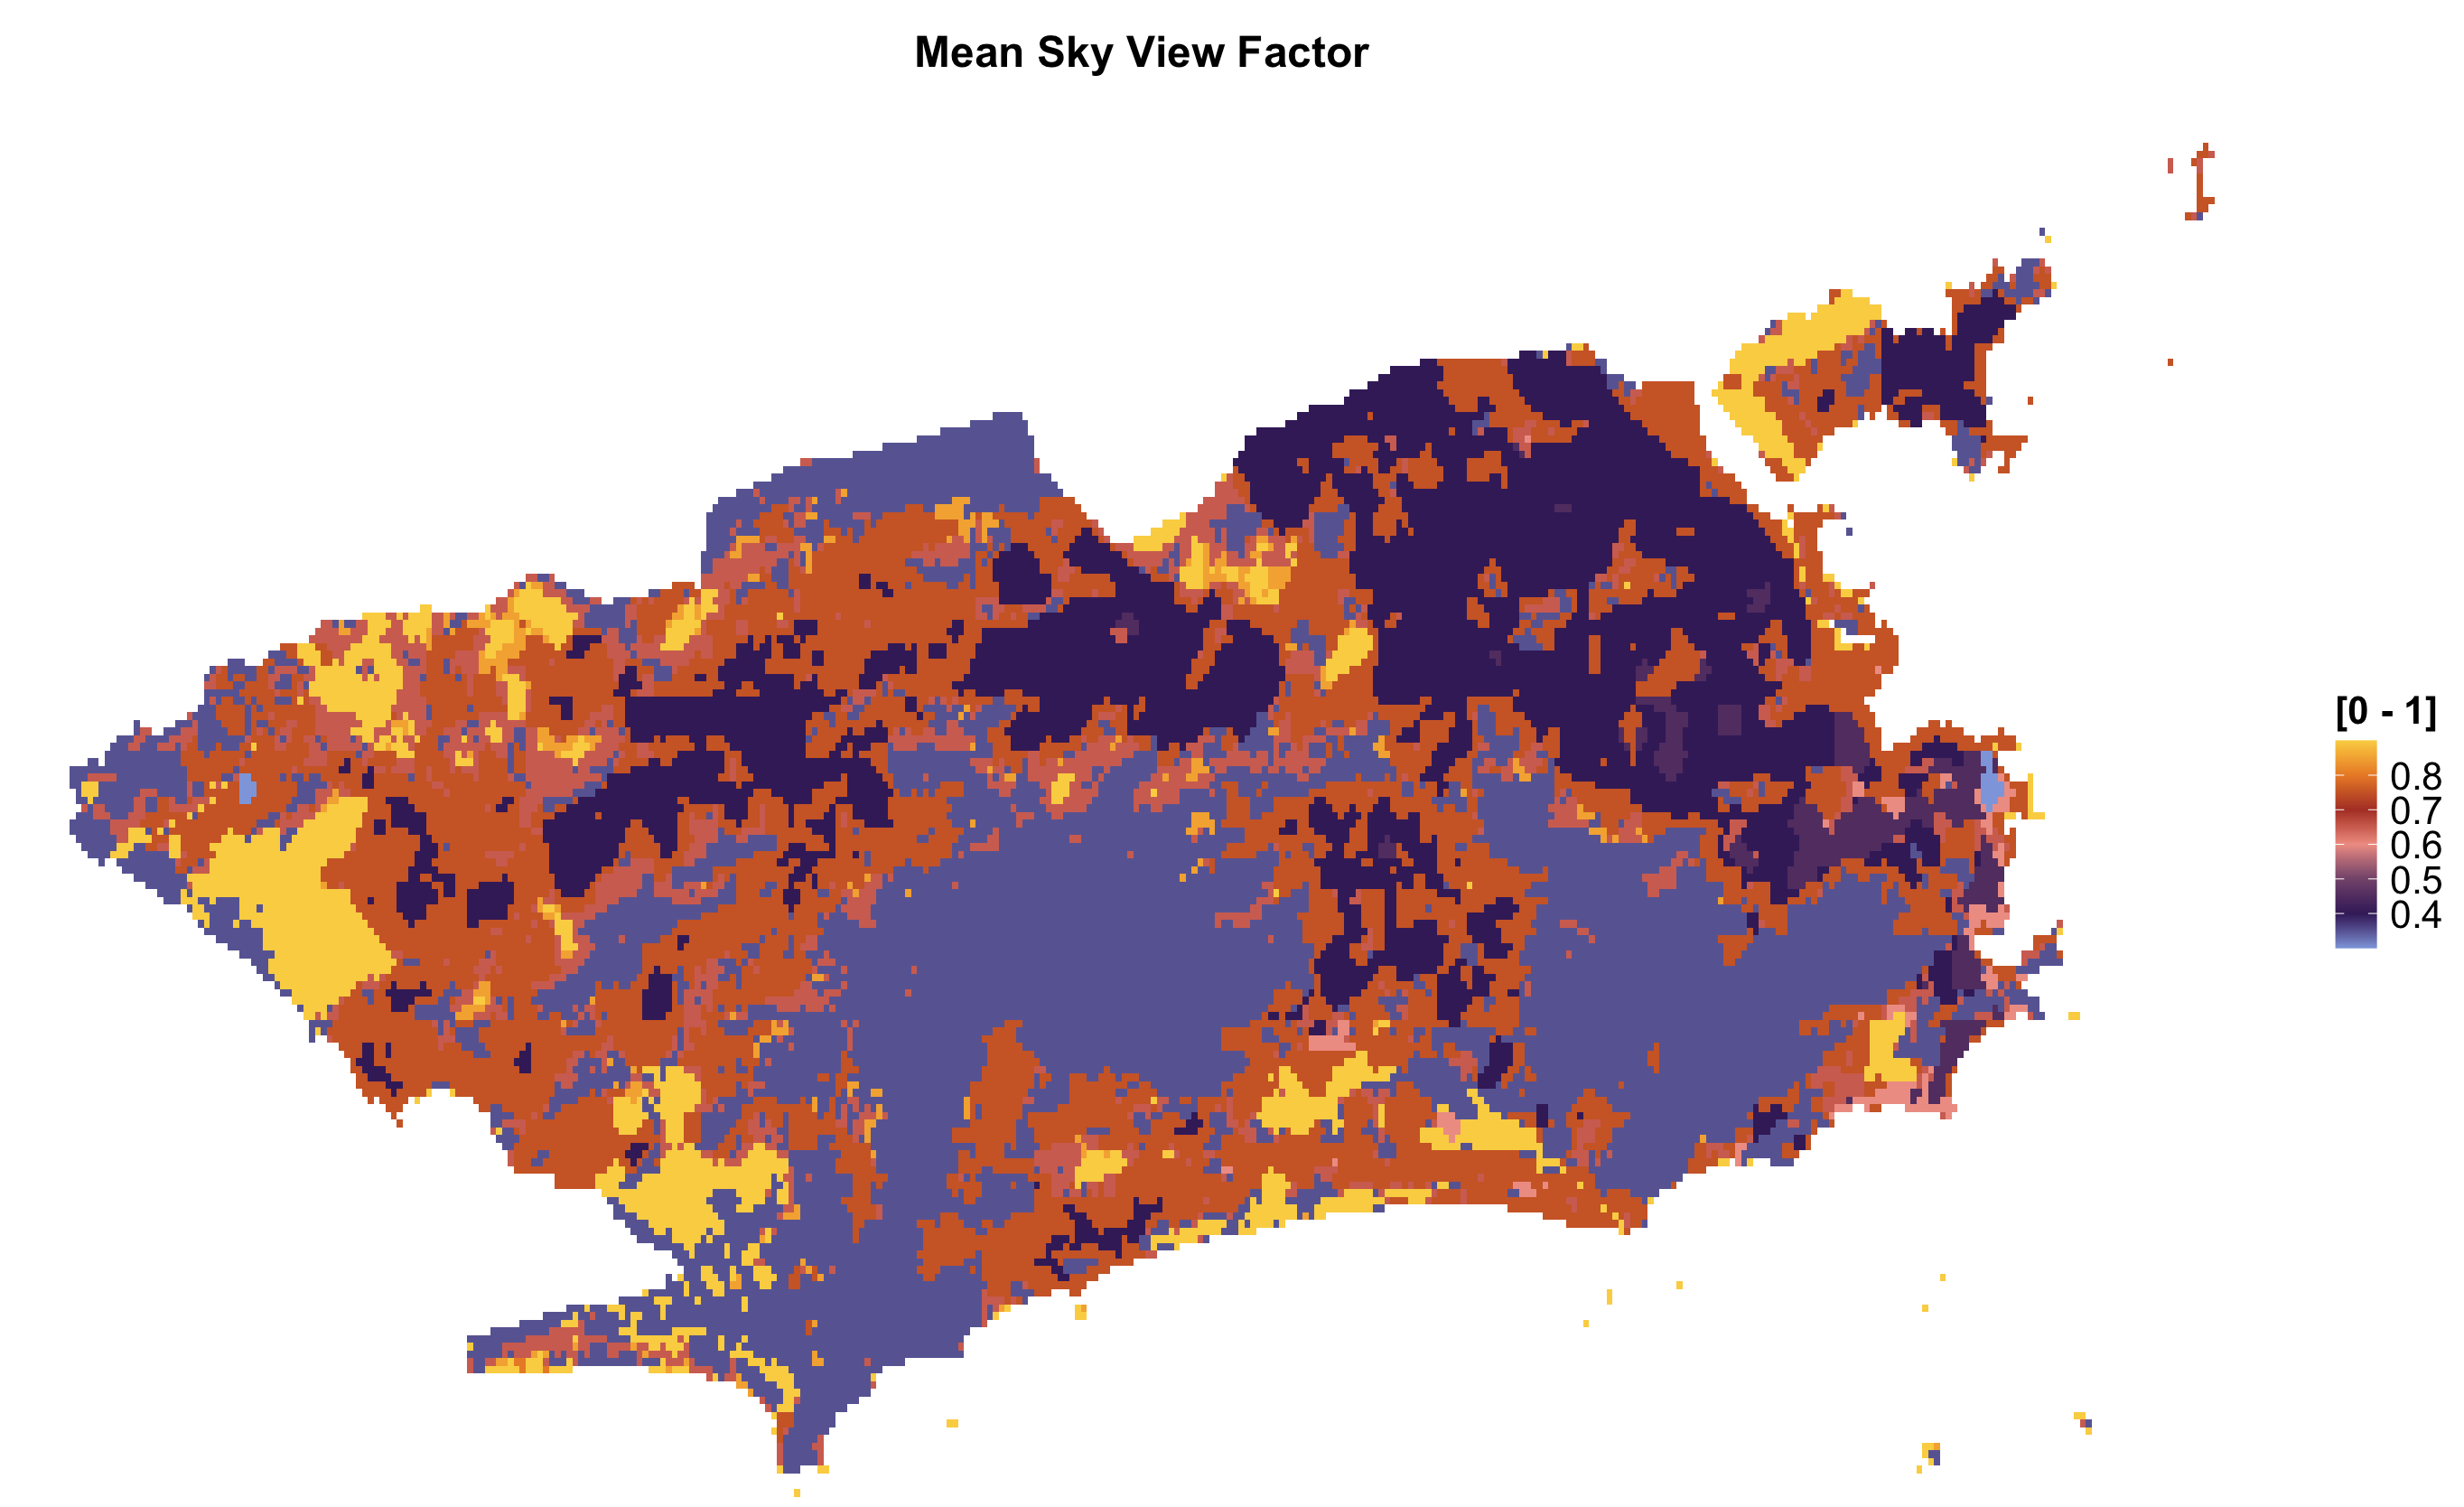
# 4. Visualize Sky View Factor
lcz_plot_parameters(lcz_params, iselect = "SVFmean")🔧 Troubleshooting
| Issue | Solution |
|---|---|
| Map not downloading | Check internet connection; try alternative dataset |
| Missing LCZ classes | Ensure city is within dataset coverage |
| Slow processing | Reduce spatial resolution or study area size |
| Parameter extraction fails | Verify LCZ map has valid values (1-17) |
📬 Have feedback or suggestions?
We welcome your feedback and suggestions! If you have ideas for improvements or spot any issues, please let us know. Click the button below to submit a new issue on our GitHub repository.
Open GitHub issue